What would the combined flag of the world look like?
Pre-reqs: Basic Python knowledge
Recently, I’ve seen a lot of posts on Reddit and Twitter such as this..


..and I started thinking about one particular aspect of such a merger of images. On a very naive level, they seem like a pretty good representation of the state of that organization. If/when you think about someone from Chinese bureaucracy or an MLB player, the picturization in your mind wouldn’t be far off.
So I thought, given my fascination of flags of countries, can we similarly think of a ‘flag of an African nation’ or a ‘flag of the Americas’ just by superimposing the individual flags?
Experiment
-
Data: The dataset I used for this experiment was from Flagpedia. Consider donating to their website if you find their work good.

-
Pre-processing: All the images in the dataset are lossless PNGs and are listed in a two letter country code (‘jp.png’, ‘us.png’). Now comes the most difficult part of this experiment, sorting countries as per continents. This took me a good one hour to go through all flags and divide them up into six folders for each continent (sorry Antarctica!). Certain conventions I assumed for this process were:
- Turkey and Russia both are included in Asia as well as Europe.
- North America = USA, Mexico, Canada + the Caribbean islands.
There may be some countries missing in this, but those are not representative of anything political, they just were not available in the dataset
- Normalization: The images all are of the same width but have different heights. To combine images, we need them to be of the same dimensions, i.e., (height, width, channel). The channel corresponds to the Blue Green Red channels for each image. The way I performed this normalization was by converting all images to the height of the image with the maximum height, and padding the extra pixels with the mean RGB values (as opposed to zero padding). This makes the representation less random and true to each individual component.
def normalize_flags(flags):
    flag_heights = []
    normalized_flags = []
    for idx in range(len(flags)):
        flag_heights.append(flags[idx].shape[0])
    max_flag_height = max(flag_heights)  #Calculate maximum height of all flags
    for idx in range(len(flags)):
        mean_value = calc_split_mean(flags[idx])
        mean_b, mean_g, mean_r = mean_value[0], mean_value[1], mean_value[2]
        new_image = [0]*3 #Empty list for 3 channels
        new_image_b = np.full((max_flag_height, flags[idx].shape[1]), mean_b)
        new_image_g = np.full((max_flag_height, flags[idx].shape[1]), mean_g)
        new_image_r = np.full((max_flag_height, flags[idx].shape[1]), mean_r)
        new_image[0] = new_image_b
        new_image[1] = new_image_g
        new_image[2] = new_image_r
        new_image = np.array(new_image, dtype=np.float32)
        new_image = np.moveaxis(new_image,0,-1)
        new_image[:flags[idx].shape[0],:flags[idx].shape[1]] = flags[idx]
        normalized_flags.append(new_image)
    return np.array(normalized_flags, dtype=np.float32)
- Combining: This is the most straightforward step, I simply add all pixel values in each channel for each image and then divide by the number of images in that set (50 flags in Africa, 196 flags for all countries).
def combine(flags):
    add = np.zeros(flags[0].shape)
    for idx in range(len(flags)):
        add = add + flags[idx]
    return add/len(flags)
Observations
These are the flags for each continent:
-
Africa
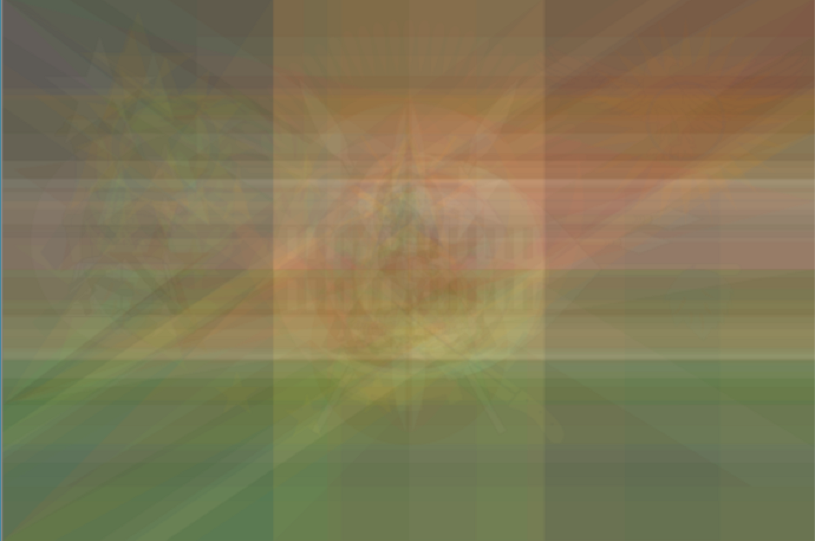 A lot of greens, relatively low amount of blue.
 -
Asia
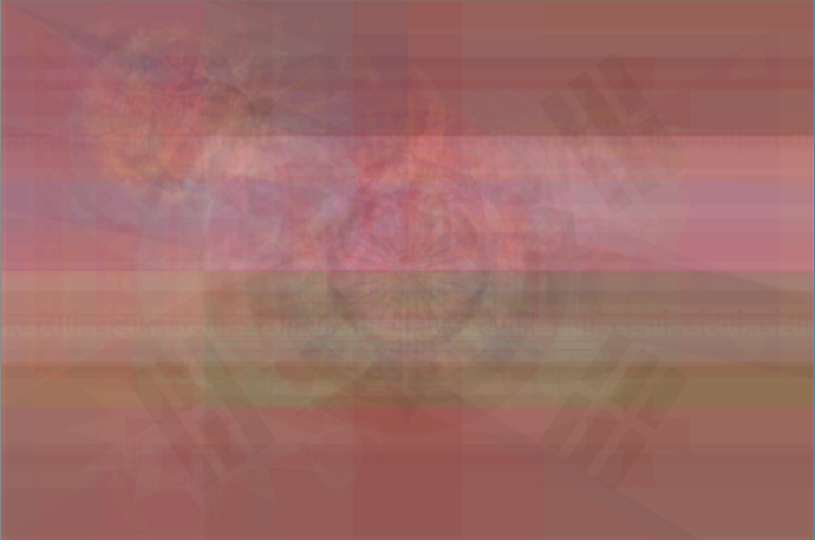 Very red.
 -
Europe
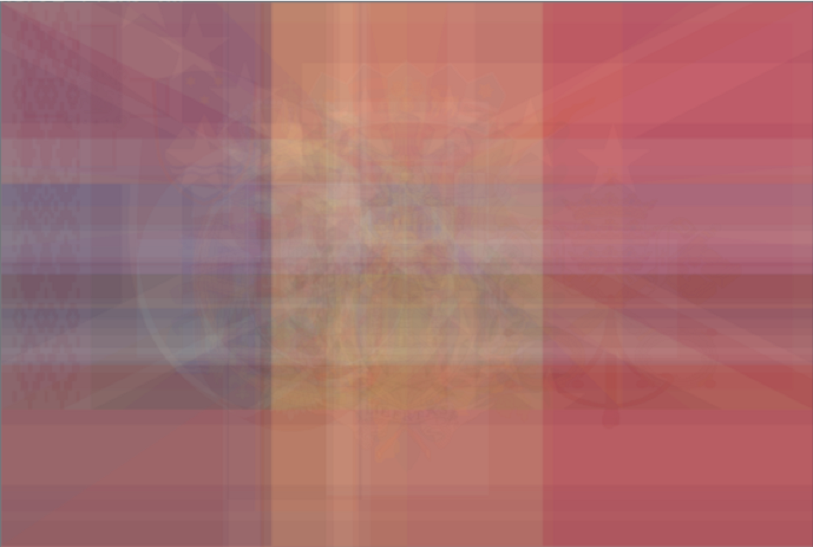 Similar to asia, pretty red. The three vertical stripe pattern of Italy, France, etc. pretty dominant.
 -
Oceania
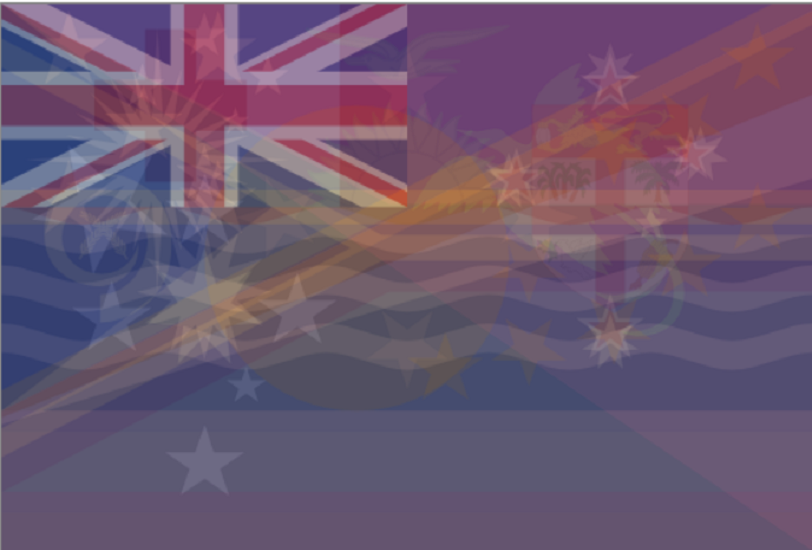 Obviously, this had to be very blue, for the ocean. This definitely is a good representation!
 -
South America
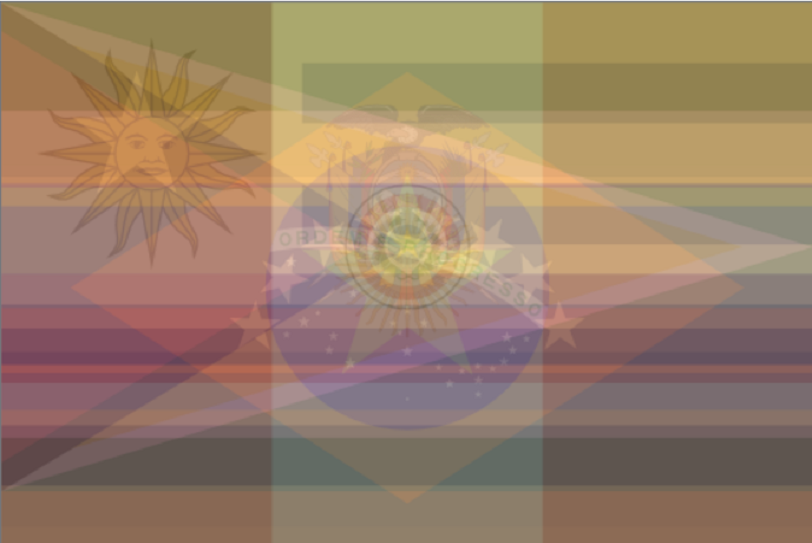 Bright yellows and greens in this one. The rainforest probably having a heavy influence!
 -
North America
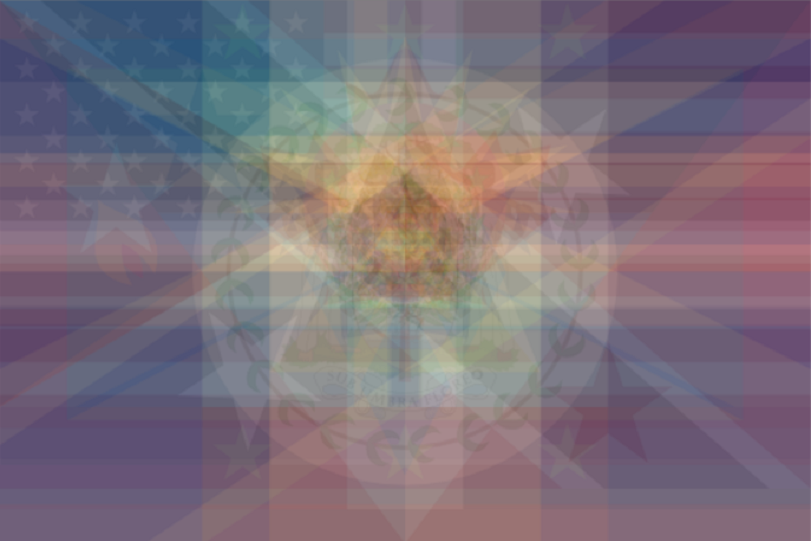 Again, high % of blue in this. Considering most nations in this continent are island nations.
 -
The whole world
 Very much in the middle, mix of bright greens from Africa and South America plus somber reds and blues from Asia and Europe. The world is a mixture of bright and somber.
Conclusions
Basic image processing is a lot of fun with Numpy and OpenCV bindings for Python. Operations such as adding tensors and calculating their mean is abstracted pretty well and fun to play around with. I plan to do more experiments on Computer Vision on this flag dataset, such as predicting which continent a flag belongs to using Convolutional Neural Networks, generating a new flag for a country belonging to a particular continent using Generative Adversarial Networks (in a super simplified manner).
If you’d like to play around with different combinations of flags, using weighted combinations, and other such experiments, fork this repo and send me your creations!